

Posted by Adam Turnquist, CMT, VP Chief Technical Strategist
Friday, November 11, 2022
The S&P 500 has been stuck below its 200-day moving average (dma) for a statistically long time. History suggests the path to recapturing the 200-dma may require more time with additional downside risk. However, after the index has been contained below the 200-dma for extended periods comparable to today, forward 52-week returns for the S&P 500 have historically been bullish.
Background
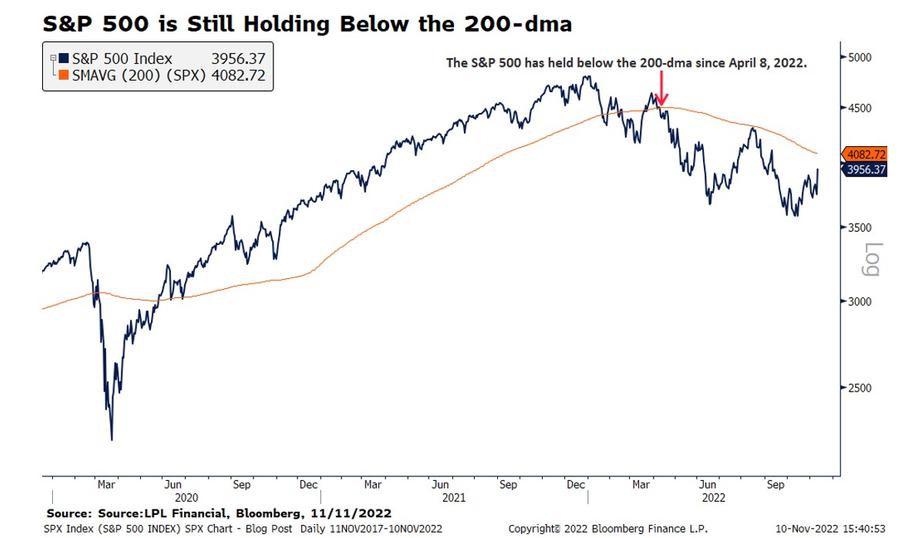
The 200-dma is one of the most commonly used tools in technical analysis. It provides investors with a longer-term perspective on trend direction as it helps smooth out the day-to-day volatility of price action. In general, if price is above the 200-dma, a security is considered in an uptrend, especially if the 200-dma is rising. On the flip side, if price is below the 200-dma, a security is considered in a downtrend, especially if the 200-dma is declining. The 200-dma can also be utilized as a risk management tool given its dynamic support and resistance attributes.
Applying these general rules to the S&P 500 implies the broader market has been in a downtrend for most of the year. The last time the S&P 500 crossed below its 200-dma was on April 8, 2022, leaving the index below the 200-dma for 149 consecutive trading days (as of November 9, 2022). For historical context, a streak of this duration or longer represents nearly a 95th percentile reading.
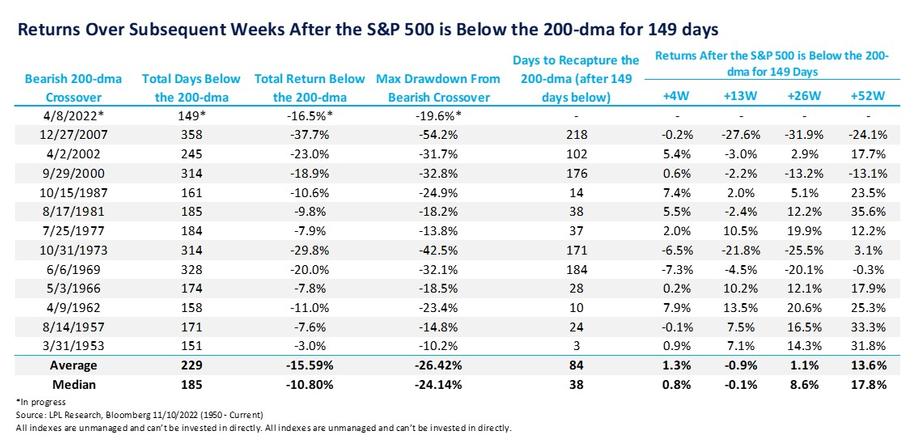
While understanding the S&P 500 has been below its 200-dma for a long period provides context on the underlying trend, it does not help answer the important question of what may happen next. To answer that question, we used history as a guide and researched prior periods when the S&P 500 held below its 200-dma for at least 149 trading days. The table below provides a summary of our research.
 Summary
Acknowledging the data is limited, comparing the current period to the historical data above suggests the S&P 500 may require more time to recapture the 200-dma. In addition, the current max drawdown of 19.6% is roughly 5%-6% below the average and median drawdowns recorded during the prior timeframes. This does not imply history will repeat, but it does highlight the potential for additional downside risk.
Finally, longer-term returns after the index has been contained below the 200-dma for 149 days suggest there is a light at the end of the tunnel. Average and median 52-week forward returns for the S&P 500 have been 13.6% and 17.8%, respectively, with nine out of 12 periods generating positive results.
Additional Facts Related to the S&P 500’s 200-dma, based on data since 1950:
- The S&P 500 has traded above the 200-dma during 71% of all trading days.
- The S&P 500 has traded at an average premium to the 200-dma of 3.2% across all trading days.
- When the index is above the 200-dma, it has historically remained above it for an average of 131 trading days. During this time, the S&P 500 has traded at an average premium to the 200-day of 7.0%.
- When the index is below the 200-dma, it has historically remained below it for an average of 80 trading days. During this time, the S&P 500 has traded at an average discount to the 200-dma of -6.3%.
- There have been 209 bullish crossovers, classified as price closing back above the 200-dma. Forward six and 12-month returns following each crossover averaged 4.8% and 7.7%, respectively. When filtering for crossovers above a rising 200-dma, the average six and 12-month returns were 4.0% and 5.7%, respectively.
- There have been 213 bearish crossovers, classified as price closing back below the 200-dma. Forward six and 12-month returns following each crossover averaged 4.3% and 6.9%, respectively. When filtering for crossovers below a declining 200-dma, the average six and 12-month returns were 5.4% and 11.3%, respectively. While these statistics may appear counterintuitive, a declining 200-dma also implies investors have likely already discounted a large degree of downside risk. It is also important to remember the market’s long-term tendency to advance over time.
IMPORTANT DISCLOSURES
This material is for general information only and is not intended to provide specific advice or recommendations for any individual. There is no assurance that the views or strategies discussed are suitable for all investors. To determine which investment(s) may be appropriate for you, please consult your financial professional prior to investing.
Investing involves risks including possible loss of principal. No investment strategy or risk management technique can guarantee return or eliminate risk in all market environments. For more information on the risks associated with the strategies and product types discussed please visit https://lplresearch.com/Risks
References to markets, asset classes, and sectors are generally regarding the corresponding market index. Indexes are unmanaged statistical composites and cannot be invested into directly. Index performance is not indicative of the performance of any investment and do not reflect fees, expenses, or sales charges. All performance referenced is historical and is no guarantee of future results.
Unless otherwise stated LPL Financial and the third party persons and firms mentioned are not affiliates of each other and make no representation with respect to each other. Any company names noted herein are for educational purposes only and not an indication of trading intent or a solicitation of their products or services.
All information is believed to be from reliable sources; however, LPL Financial makes no representation as to its completeness or accuracy.
Securities and advisory services offered through LPL Financial, a registered investment advisor and broker-dealer. Member FINRA/SIPC.
Tracking # 1-05345891
For a list of descriptions of the indexes and economic terms referenced in this publication, please visit our website at lplresearch.com/definitions.