

Posted by Adam Turnquist, CMT, VP Chief Technical Strategist
Friday, February 10, 2023
Negative sentiment has been an ongoing theme throughout this bear market. Continuous monetary tightening, surging interest rates and inflation, and slowing growth have been a few catalysts behind the widespread pessimism. However, with stocks staging an impressive comeback since the start of the year, there have been recent signs of bears finally going into hibernation.
Since 1987, the American Association of Individual Investors (AAII) has surveyed its members each week with a simple question: “Do you feel the direction of the stock market over the next six months will be up (bullish), no change (neutral) or down (bearish)?” The bullish, bearish, and neutral percentage readings provide a temperature gauge for risk appetite among investors. Investors also use the readings as contrarian indicators when bullish and bearish sentiment reaches extremes.
The chart below breaks down the weekly AAII bullish (top) and bearish (middle) percent readings, along with the spread between the data series shown in the bottom panel (Bull-Bear Index).
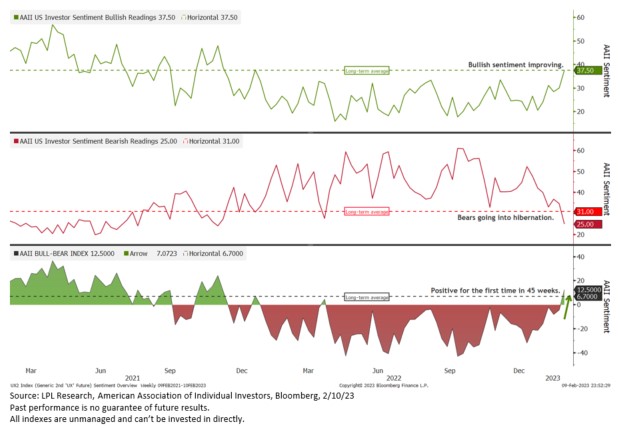
Bullish sentiment has been trending higher since the start of the year, lifting the bullish percent from 20.5% at the beginning of the year to 37.5% as of Thursday, February 9. While this has been a welcomed improvement, the most recent reading is only back to its long-term average (green dotted line at 37.5%).
Bearish sentiment remained stubbornly high throughout most of last year. However, sentiment started to slip as the calendar turned to 2023. The current reading of 25.0% marks the lowest level of bearish sentiment since November 2021.
Comparing sentiment between bulls and bears highlights how consistent bearish sentiment has been over the last year. In fact, the Bull-Bear index (bullish minus bearish sentiment) turned positive this week for the first time in 45 weeks, ending the longest streak of negative readings on record.
What does this mean for stocks? We analyzed how the market performed after a prolonged period of bearish sentiment ended. We defined a prolonged period as eight straight weeks or more of bearish sentiment exceeding bullish sentiment. The table below provides a breakdown of the results.
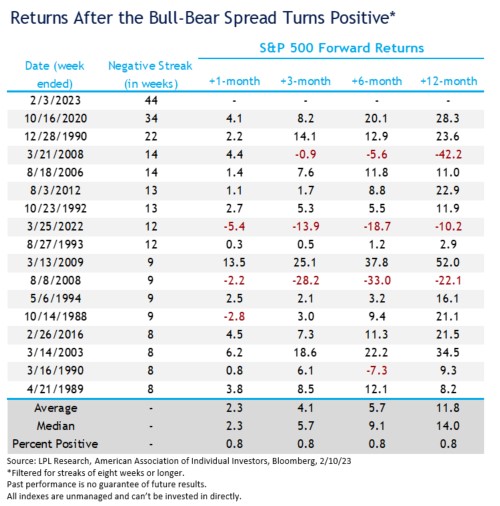
Historically, after these streaks end and bullish sentiment outpaces bearish sentiment, the S&P 500 has historically generated positive returns. On a 12-month basis, the index produced respective average and median returns of 11.8% and 14.0%, with 13 of the 16 periods yielding positive returns. For reference, the S&P 500 has generated average 12-month rolling returns of 9.1% with a 77% positivity rate since 1987.
In conclusion, bears finally appear to be hibernating as bullish sentiment improves. Historically, the end of prolonged periods of bearish sentiment has usually led to above-average market returns over the next twelve months. While sentiment is clearly not a science and is often best utilized as a contrarian indicator, the recent transition toward improving optimism suggests investors are becoming more confident with the latest recovery in stocks, something absent from prior recovery periods in 2022.
IMPORTANT DISCLOSURES
This material is for general information only and is not intended to provide specific advice or recommendations for any individual. There is no assurance that the views or strategies discussed are suitable for all investors. To determine which investment(s) may be appropriate for you, please consult your financial professional prior to investing.
Investing involves risks including possible loss of principal. No investment strategy or risk management technique can guarantee return or eliminate risk in all market environments. For more information on the risks associated with the strategies and product types discussed please visit https://lplresearch.com/Risks
References to markets, asset classes, and sectors are generally regarding the corresponding market index. Indexes are unmanaged statistical composites and cannot be invested into directly. Index performance is not indicative of the performance of any investment and do not reflect fees, expenses, or sales charges. All performance referenced is historical and is no guarantee of future results.
Unless otherwise stated LPL Financial and the third party persons and firms mentioned are not affiliates of each other and make no representation with respect to each other. Any company names noted herein are for educational purposes only and not an indication of trading intent or a solicitation of their products or services.
All information is believed to be from reliable sources; however, LPL Financial makes no representation as to its completeness or accuracy.
Securities and advisory services offered through LPL Financial, a registered investment advisor and broker-dealer. Member FINRA/SIPC.
Tracking # 1-05359646