

Posted by Jeffrey Buchbinder, CFA, Chief Equity Strategist
Thursday, September 1, 2022
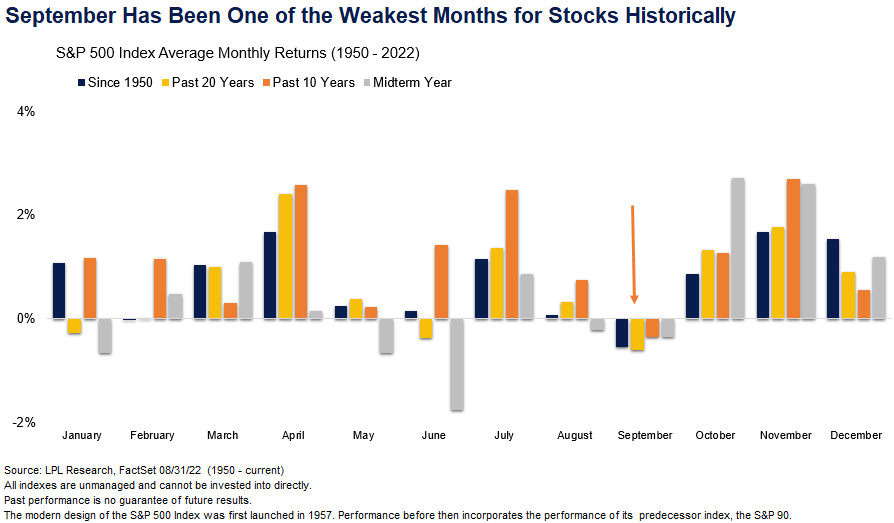
For investors September is often a month to remember but for the wrong reasons. In fact, as shown in the LPL Chart of the Day, September has historically been one of the weakest months of the year for stocks.
“It’s widely known among investors that stocks tend not to do very well in September,” wrote LPL Chief Equity Strategist Jeffrey Buchbinder. “The combination of peak hawkishness from the Fed and the frustratingly slow pace at which inflation is cooling could make this a tough month for stocks.”
Meanwhile, earnings season isn’t available as a potential positive market catalyst, Europe’s energy crisis is worsening, and COVID-related lockdowns in China continue.
Here are some numbers to illustrate the consistency of this seasonal pattern:
- Since 1950, the S&P 500 has averaged a 0.54% decline in September, worst of all 12 months.
- Over the past 20 years, September is still the worst month for stocks with an average decline of 0.6%, but January and June are close behind with average losses of 0.28% and 0.38%, respectively.
- Over the past 10 years, September is the only month when the S&P 500 averages a loss (0.35%).
- During midterm years the S&P 500 has averaged a 0.35% decline in September, though that ranks ninth and is better than January (-0.66%), May (-0.66%), and June (-1.76%).
- Finally, from Bespoke Investment Group, these negative seasonal effects are exacerbated when the index is down on a year-to-date basis heading into the month. When the S&P has been down year to date through August (as it is this year), the index has averaged a decline of 3.4% in September.
This isn’t a very uplifting message but consider that October is right around the corner and that month kicks off a string of some of the best months of the year for stocks. In fact, during midterm election years, the best three months of the year have been October, November, December. Here’s hoping stocks can hang in there for the next 30 days and then stage a strong fourth quarter rally. Based on history, that seems like a reasonable expectation.
IMPORTANT DISCLOSURES
This material is for general information only and is not intended to provide specific advice or recommendations for any individual. There is no assurance that the views or strategies discussed are suitable for all investors. To determine which investment(s) may be appropriate for you, please consult your financial professional prior to investing.
Investing involves risks including possible loss of principal. No investment strategy or risk management technique can guarantee return or eliminate risk in all market environments. For more information on the risks associated with the strategies and product types discussed please visit https://lplresearch.com/Risks
References to markets, asset classes, and sectors are generally regarding the corresponding market index. Indexes are unmanaged statistical composites and cannot be invested into directly. Index performance is not indicative of the performance of any investment and do not reflect fees, expenses, or sales charges. All performance referenced is historical and is no guarantee of future results.
Unless otherwise stated LPL Financial and the third party persons and firms mentioned are not affiliates of each other and make no representation with respect to each other. Any company names noted herein are for educational purposes only and not an indication of trading intent or a solicitation of their products or services.
All information is believed to be from reliable sources; however, LPL Financial makes no representation as to its completeness or accuracy.
For a list of descriptions of the indexes and economic terms referenced in this publication, please visit our website at lplresearch.com/definitions.
Securities and advisory services offered through LPL Financial, a registered investment advisor and broker-dealer. Member FINRA/SIPC.
Tracking # 1-05320046