

Posted by George Smith, CFA, CAIA, CIPM, Portfolio Strategist
Friday, October 14, 2022
The latest weekly data from the American Association of Individual Investors (AAII) showed the percentage of individual investors who are bullish about short-term market expectations at very depressed levels (20.4%), and continued the trend of an extremely elevated proportion of bearish investors (55.9%). This puts the spread between the bulls and the bears at -35.5%, only the 21st time in the survey’s 35 year history the reading has been this pessimistic.
As shown in the LPL Chart of the Day, investor sentiment, as measured by the spread between bulls and bears in the AAII data, is still in extreme territory, more than two standard deviations below its long-term average. The mid-summer stock market bounce had brought some bulls back, with the bull-bear spread getting close to zero by mid-August, but since then investor sentiment has fallen along with the stock markets, with the spread reaching a low of -43 in mid-September (the fourth most pessimistic ever).
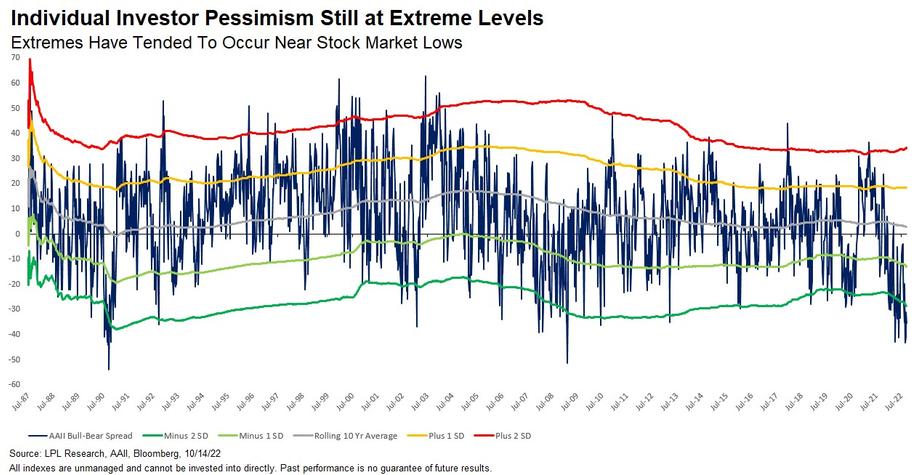
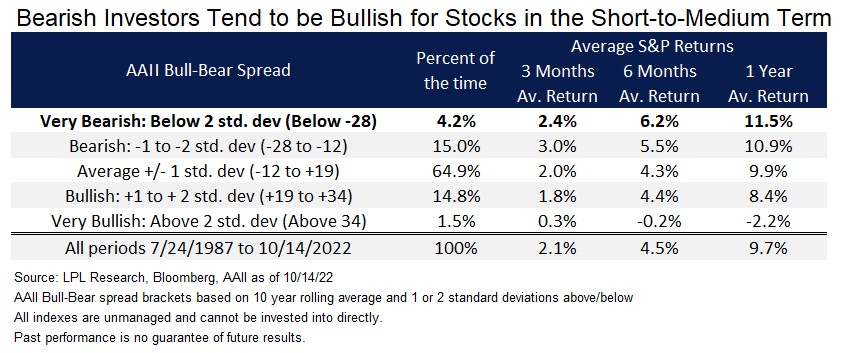
We continue to view the AAII as a contrarian indicator with extremes in negative sentiment tending, on average, bullish for near-term stock market returns and extreme investor optimism tending to be bearish for the near-term outlook. The more extreme the pessimism (or optimism) the greater the outperformance (or underperformance) over the next year. When the spread has been as low as it is now (-35.5 or approximately 2.5 standard deviations below average), the returns a year out have been even stronger, with average returns of 7%, 16% and 18% over 3, 6, and 12 month periods.
IMPORTANT DISCLOSURES
This material is for general information only and is not intended to provide specific advice or recommendations for any individual. There is no assurance that the views or strategies discussed are suitable for all investors or will yield positive outcomes. Investing involves risks including possible loss of principal. Any economic forecasts set forth may not develop as predicted and are subject to change.
References to markets, asset classes, and sectors are generally regarding the corresponding market index. Indexes are unmanaged statistical composites and cannot be invested into directly. Index performance is not indicative of the performance of any investment and do not reflect fees, expenses, or sales charges. All performance referenced is historical and is no guarantee of future results.
Any company names noted herein are for educational purposes only and not an indication of trading intent or a solicitation of their products or services. LPL Financial doesn’t provide research on individual equities. All information is believed to be from reliable sources; however, LPL Financial makes no representation as to its completeness or accuracy.
All index and market data from FactSet and MarketWatch.
This Research material was prepared by LPL Financial, LLC.
Securities and advisory services offered through LPL Financial (LPL), a registered investment advisor and broker-dealer (member FINRA/SIPC).
Insurance products are offered through LPL or its licensed affiliates. To the extent you are receiving investment advice from a separately registered independent investment advisor that is not an LPL affiliate, please note LPL makes no representation with respect to such entity.
- Not Insured by FDIC/NCUA or Any Other Government Agency
- Not Bank/Credit Union Guaranteed
- Not Bank/Credit Union Deposits or Obligations
- May Lose Value
For Public Use – Tracking # 1-05336905