

Thursday, February 2, 2023
Posted by Barry Gilbert, PhD, CFA, Asset Allocation Strategist
The first month of 2023 is now behind us and it felt very different than 2022. In 2022, the S&P 500 and the Bloomberg U.S. Aggregate Bond Index (“Agg”) both fell and there was much talk of the demise of the “60/40” portfolio (a portfolio of 60% stocks and 40% bonds). But the S&P 500 and the Agg were not only both higher in January, they were both in the top 10% of all monthly returns going back to 1980.
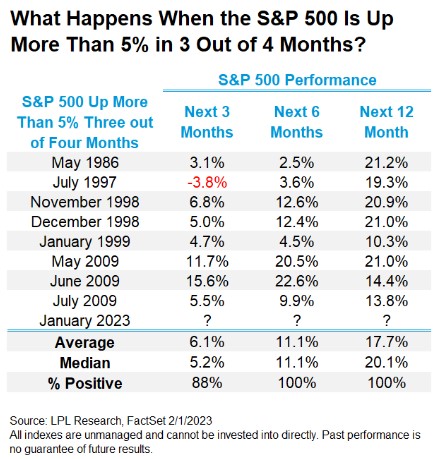
The S&P 500 finished January 6.3% higher on a total return basis. That’s the third time in the last four months it was up more than 5%. (Granted, December 2022 was down more than 5%.) A cluster of monthly returns up more than 5% like this is relatively unusual, with gains of more than 5% in three out of four months occurring only eight times since 1980. That’s a small sample and a 5% gain is a somewhat arbitrary line, but nevertheless it’s still noteworthy that returns in the ensuing three-, six-, and twelve-month periods were usually quite good. In fact, as shown in the LPL Chart of the Day, the next twelve months were higher at least 10% every time on a total return basis, with an average gain of over 17%. LPL Research’s asset allocation committee continues to recommend an overweight allocation to equities on the premise market participants may look past a heavily anticipated potential recession in the first half of 2023, even if there may be a pick-up in near-term volatility if a recession should occur.
Some other highlights of the January return environment:
- The consumer discretionary and communication services sectors were the top two performing sectors in January, after being the worst performers in 2022. LPL Research’s asset allocation committee continues to recommend underweights to those sectors, but we are watching the environment closely.
- Long maturity Treasuries have been on a tear over the last three months, the Bloomberg U.S. Long Treasury Index returning over 12% in November 2022–January 2023. Our asset allocation committee shifted its recommended interest rate sensitivity from underweight, compared to the Agg benchmark, to neutral at the beginning of October 2022. While we aren’t chasing long maturity bonds, we think an emphasis on shorter-maturity bonds in a diversified portfolio is no longer merited.
- While Agg returns weren’t as spectacular as long Treasuries, the Agg saw a total return of over 6% over the last three months, the best three-month period since January 2009.
- The MSCI EAFE Index and MSCI Emerging Market Index both outpaced the S&P 500 in January. EAFE has outperformed the S&P 500 Index over the twelve months ending January 31 and our asset allocation committee has warmed to international equities as economic news that has been “less bad than feared” challenges the level of pessimism that had been priced in to international markets.
- Growth-style domestic stocks outperformed value-style stocks for the first time in six months, as measured by the Russell 1000 Value and Growth indexes. The five-month streak of value outperforming growth that ended in December 2022 is the longest since November 2008.
It’s been an encouraging start to the year after the challenges of 2022. Undoubtedly, 2023 will provide its share of market ups and downs and there are plenty of risks to monitor closely, including a possible recession, continued tightening by the Federal Reserve, still high inflation despite strong signs that it’s settling down, and the conflict in Ukraine. But after 2022, it’s good to have a solid month in the books to start the year.
IMPORTANT DISCLOSURES
This material is for general information only and is not intended to provide specific advice or recommendations for any individual. There is no assurance that the views or strategies discussed are suitable for all investors or will yield positive outcomes. Investing involves risks including possible loss of principal. Any economic forecasts set forth may not develop as predicted and are subject to change.
References to markets, asset classes, and sectors are generally regarding the corresponding market index. Indexes are unmanaged statistical composites and cannot be invested into directly. Index performance is not indicative of the performance of any investment and do not reflect fees, expenses, or sales charges. All performance referenced is historical and is no guarantee of future results.
Any company names noted herein are for educational purposes only and not an indication of trading intent or a solicitation of their products or services. LPL Financial doesn’t provide research on individual equities. All information is believed to be from reliable sources; however, LPL Financial makes no representation as to its completeness or accuracy.
For a list of descriptions of the indexes and economic terms referenced in this publication, please visit our website at lplresearch.com/definitions.
All index and market data from FactSet and MarketWatch.
This Research material was prepared by LPL Financial, LLC.
Securities and advisory services offered through LPL Financial (LPL), a registered investment advisor and broker-dealer (member FINRA/SIPC).
Insurance products are offered through LPL or its licensed affiliates. To the extent you are receiving investment advice from a separately registered independent investment advisor that is not an LPL affiliate, please note LPL makes no representation with respect to such entity.
- Not Insured by FDIC/NCUA or Any Other Government Agency
- Not Bank/Credit Union Guaranteed
- Not Bank/Credit Union Deposits or Obligations
- May Lose Value
For Public Use – Tracking #1-05358463