
Posted by George Smith, CFA, CAIA, CIPM, Portfolio Strategist
Thursday, April 20, 2023
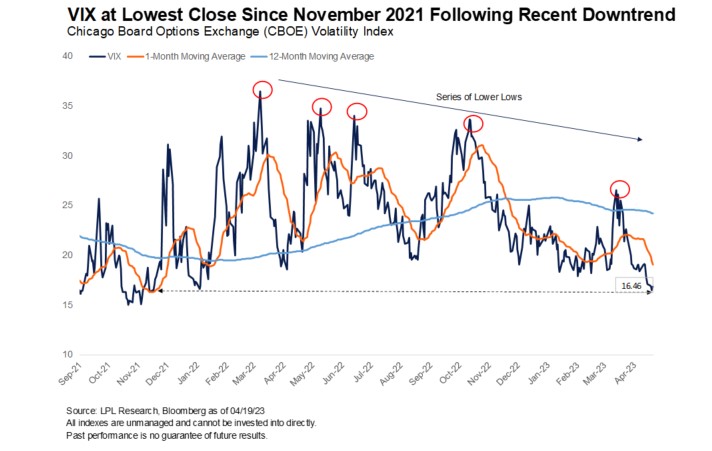
Implied volatility, as measured by the Chicago Board Options Exchange (CBOE) Volatility Index (VIX), closed yesterday at 16.46, its lowest closing level since mid-November 2021. Today we take a look at possible reasons for the decline in the VIX and what it could mean for short-term stock market returns.
The VIX provides a real-time update of expectations for volatility on the S&P 500 over the next 30 days. The VIX represents implied volatility derived from the aggregate values of a weighted basket of S&P 500 put and call options over a range of strike prices. The VIX is often referred to as the “fear gauge” because generally, a rising VIX is associated with increased fear in the marketplace and falling stock prices, while a declining VIX is associated with decreased investor fear and rising stock prices. In addition to speculative positioning, the VIX is commonly used to hedge long positions.
This new multi-year low for the VIX may be surprising to many investors as they access a wall of economic worry consisting of recent bank failures, uncertainty in the path of interest rates, rising recession concerns, still lingering inflation, and a looming debt ceiling standoff. As highlighted in the chart below the VIX has been making lower highs since closing at 36.45 in March 2022. During the whole bear market the VIX has actually been fairly subdued compared to history. Typically it spikes to at least 40 in times of major market stress. Both the 1-month and 12-month moving averages are now in downtrends, with the next technical resistance level around 15, a support level that has held since the very early days of the COVID-19 outbreak.
Why is the VIX trending lower?
There are a couple of possible structural reasons for the VIX to be hitting multi-year lows amidst such an uncertain economic and market environment. One could be the increased popularity of zero days to expiration option contracts, or what many investors call “0DTE.” As the name implies, these are call or put options with less than one day until expiration. For the S&P 500, the CBOE’s recent addition of Tuesday and Thursday weekly expirations to already listed Monday, Wednesday, and Friday contracts meant investors could trade 0DTE contracts daily on the index, providing a clean way for investors to hedge daily event risk without buying VIX options. Volume has climbed steadily since last April and May when the new contracts were added.
Another reason why VIX upside has been relatively subdued could simply be due to fewer positions to hedge. With short-term rates surging over the last year and economic uncertainty running high, money market funds have been taking in record inflows. According to the Investment Company Institute (ICI), assets in money market funds are now over $5 trillion, surpassing the peak pandemic levels.
What could new lows in the VIX suggest for future stock returns?
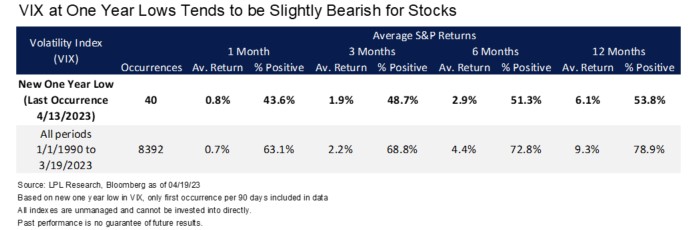
Like many other measures of market sentiment that we monitor, extreme relative levels of volatility have historically had the potential to be contrarian signals when it comes to predicting stocks prices over the short term. As we looked at here last year, extreme highs in the VIX tend the lead to above average future returns for stocks and, as shown in the table below, new one-year lows in the VIX tend to have an opposite, and more muted, effect of below average returns. Based on 40 occurrences of new one year lows in the VIX (that happened at least 90 days from the prior occurrence) the 3-month to 12-month returns for the S&P 500 Index were all below average, and each period studied, including 1-month returns, had a significantly lower percentage of positive returns than average. Possible reasons for this are markets catching their breath, or running out of steam, after hitting new one-year lows in the VIX (following on from the faster/larger stock market increases that tend to follow extreme high spikes in the VIX that occur around market lows).
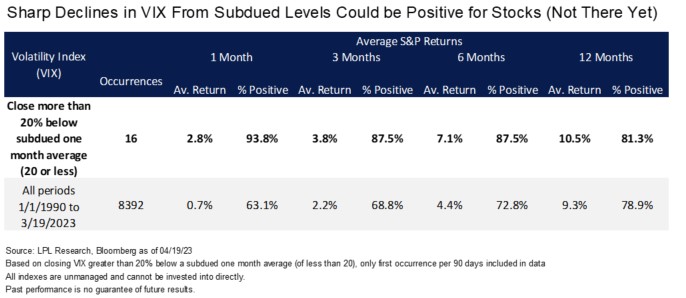
A more positive sign for near term stock market returns would be if we were to see a continued sharp decrease in the VIX. Looking back at periods when the VIX was fairly subdued as it is now (which we defined as having a one-month moving average below 20) and it closed at least 20% lower than the one-month average, the S&P 500 Index saw above-average returns and percentage of positive returns across all time periods studied. The latest VIX close was about 15% below the one-month moving average so we are not at this level yet. Caution should be taken with the small sample size and the concentration of the occurrences in the 2013 to 2019 period in the middle of the last bull market.
Summary
While the VIX data suggests a cautious approach in the short term, generally periods of falling volatility have been associated with rising stock markets. We still maintain a modest overweight to equities funded from cash (where the return profiles of short term products are attractive but reinvestment risk has risen), as equities may benefit from falling inflation and a prompt end to Federal Reserve rate hikes. We recommend a neutral allocation to fixed income, as valuations have become more attractive relative to equities amid higher interest rates.
IMPORTANT DISCLOSURES
This material is for general information only and is not intended to provide specific advice or recommendations for any individual. There is no assurance that the views or strategies discussed are suitable for all investors or will yield positive outcomes. Investing involves risks including possible loss of principal. Any economic forecasts set forth may not develop as predicted and are subject to change.
References to markets, asset classes, and sectors are generally regarding the corresponding market index. Indexes are unmanaged statistical composites and cannot be invested into directly. Index performance is not indicative of the performance of any investment and do not reflect fees, expenses, or sales charges. All performance referenced is historical and is no guarantee of future results.
Any company names noted herein are for educational purposes only and not an indication of trading intent or a solicitation of their products or services. LPL Financial doesn’t provide research on individual equities. All information is believed to be from reliable sources; however, LPL Financial makes no representation as to its completeness or accuracy.
All index and market data from FactSet and MarketWatch.
This Research material was prepared by LPL Financial, LLC.
Securities and advisory services offered through LPL Financial (LPL), a registered investment advisor and broker-dealer (member FINRA/SIPC).
Insurance products are offered through LPL or its licensed affiliates. To the extent you are receiving investment advice from a separately registered independent investment advisor that is not an LPL affiliate, please note LPL makes no representation with respect to such entity.
Not Insured by FDIC/NCUA or Any Other Government Agency | Not Bank/Credit Union Deposits or Obligations |Not Bank/Credit Union Guaranteed | May Lose Value
For a complete list of descriptions of the indexes and economic terms referenced in this publication, please visit our website at lplresearch.com/definitions
For Public Use – Tracking # 1- 05367813