

Posted by Barry Gilbert, PhD, CFA, Asset Allocation Strategist
Thursday, May 11, 2023
- The Consumer Price Index (CPI) peaked almost a year ago now in June 2022.
- Historically, CPI peaks tend to come around the start of a recession on average. Clearly that wasn’t the case this time
- Stock market risks have been most pronounced as we move toward the CPI peak. Coming off of it, returns have been near the long-term average.
- When the CPI peak is above 9%, as it was this time, the post-peak performance of the S&P 500 Index has been meaningfully stronger, on average.
- The inflation story may not be over, but markets may have already been starting to look past it over the last six months, consistent with post-peak behavior historically.
We are coming up on being a full year removed from the peak in inflation next month, measured by the one-year change in the Consumer Price Index (CPI). CPI peaked in June 2022 at 9.1%. Year-over-year inflation has decline every month since, with the most recent reading for April 2023, released yesterday, at 4.9%. (For some thoughts on yesterday’s CPI report from LPL Chief Economist Jeffrey Roach, see yesterday’s LPL Research blog, “Inflation with a 4 Handle.”)
While every cycle is different, looking at past inflation peaks can provide some insights on both recessions and the outlook for stocks. Perhaps most noteworthy about last June’s inflation peak is that it’s so far behind us while recession risk remains elevated looking forward. When it comes to recessions, peak inflation has on average roughly coincided with the start of a recession but there is a lot of variation. While it’s less common, peak inflation has preceded the start of a recession by a year or more. If the economy were to go into recession in the second half of the year, we could chalk up the more delayed economic downturn to a Federal Reserve (Fed) that was initially behind the curve in fighting inflation along with monetary policy acting with its typical lag. Some economic tailwinds from post-pandemic pent up demand, especially on the services side, might also have contributed to greater economic resilience.
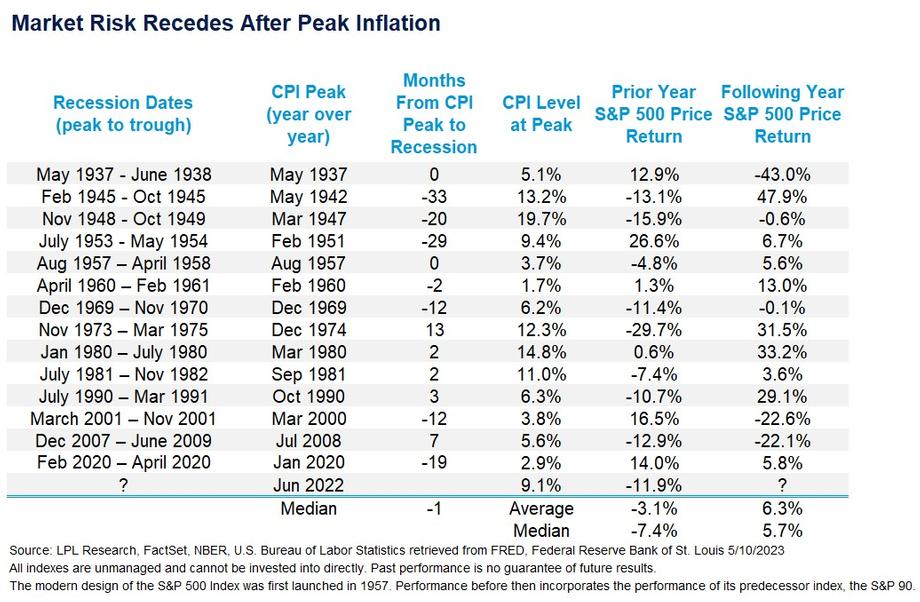
When it comes to market behavior, it shouldn’t be surprising that S&P 500 Index price returns fared better in the year following peak inflation than in the year prior. Both the median and average returns are negative in the year leading up to the peak. That makes sense: Markets are adjusting to the real time experience of higher inflation and its potential policy impact. By contrast, average returns are positive the year after peak CPI, but just roughly in line with the average overall.
What’s noteworthy is that higher inflation at peak increases the odds of a larger rebound post peak even though inflation generally still remains elevated a year later. Granted it’s a small sample, but the average S&P 500 Index return in the following year when peak inflation has been over 9% has been 20.4%. For markets, it’s been the direction of inflation rather than the level that matters, even though a higher peak meant the economy was still dealing with higher inflation. That might not be all that relevant at this point since the one-year period following the peak looked at in the study is almost behind us. But it does tell us that market risks from higher inflation may be yesterday’s story, even if the full impact of higher interest rates may still be ahead.
The progress already made on inflation is just one of the reasons LPL’s Asset Allocation Committee continues to recommend a modest equity overweight for appropriate investors even as we gauge the potential impact of a recession in the second half of the year.
IMPORTANT DISCLOSURES
This material is for general information only and is not intended to provide specific advice or recommendations for any individual. There is no assurance that the views or strategies discussed are suitable for all investors or will yield positive outcomes. Investing involves risks including possible loss of principal. Any economic forecasts set forth may not develop as predicted and are subject to change.
References to markets, asset classes, and sectors are generally regarding the corresponding market index. Indexes are unmanaged statistical composites and cannot be invested into directly. Index performance is not indicative of the performance of any investment and do not reflect fees, expenses, or sales charges. All performance referenced is historical and is no guarantee of future results.
Any company names noted herein are for educational purposes only and not an indication of trading intent or a solicitation of their products or services. LPL Financial doesn’t provide research on individual equities. All information is believed to be from reliable sources; however, LPL Financial makes no representation as to its completeness or accuracy.
For a list of descriptions of the indexes and economic terms referenced in this publication, please visit our website at lplresearch.com/definitions.
All index and market data from FactSet and MarketWatch.
This Research material was prepared by LPL Financial, LLC.
Securities and advisory services offered through LPL Financial (LPL), a registered investment advisor and broker-dealer (member FINRA/SIPC).
Insurance products are offered through LPL or its licensed affiliates. To the extent you are receiving investment advice from a separately registered independent investment advisor that is not an LPL affiliate, please note LPL makes no representation with respect to such entity.
- Not Insured by FDIC/NCUA or Any Other Government Agency
- Not Bank/Credit Union Guaranteed
- Not Bank/Credit Union Deposits or Obligations
- May Lose Value
For Public Use – Tracking # 1-05370253