

Posted by Adam Turnquist, CMT, VP Chief Technical Strategist
Friday, June 23, 2023
Key Takeaways:
- As expected, the Federal Reserve (Fed) paused its rate-hiking cycle last week after 15 consecutive months of tightening. Over the last 35 years, there have been five other monetary policy periods when the Fed paused after a major rate-hiking cycle. During these periods, it took anywhere from four to 15 months before the Fed started cutting rates, with the average pause lasting 6.8 months.
- Stocks have historically done relatively well after a Fed pause. The S&P 500 has climbed higher over the following 12 months during four of the last five pauses, generating an average gain of 16.4%.
- Value has edged out growth following a Fed pause. The Russell 1000 Value Index has posted an average 12-month gain of 17.4% after a Fed pause, outpacing the average gain of the Russell 1000 Growth Index by 2.7%.
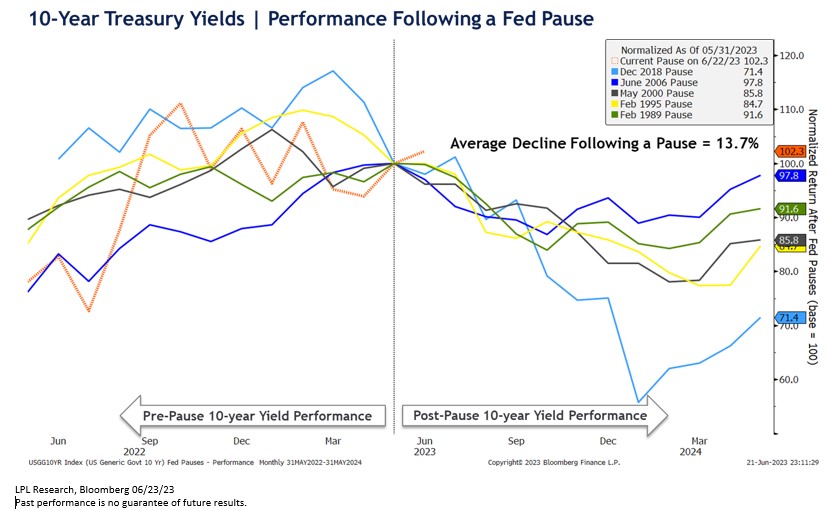
- Interest rates have historically declined after a Fed pause. The 10-year Treasury yield has declined after all five pauses, falling by an average of 13.7% over the following 12 months.
After 15 straight months of raising interest rates, the Federal Open Market Committee (FOMC) kept rates unchanged last week during their June monetary policy meeting. The pause in rate hikes was widely expected. The surprise came in the Fed’s updated Summary of Economic Projections (SEP), where policymakers penciled in two additional 25 basis point rate hikes by year-end.
Fed Chair Jerome Powell echoed the hawkish forecasts during his post-FOMC press conference. Powell noted the Fed will have to “keep at it” as inflation remains stubbornly high against a backdrop of a “very tight” labor market. He doubled down on his hawkish remarks during his Semiannual Monetary Policy congressional hearing this week, telling lawmakers, “Inflation pressures continue to run high, and the process of getting inflation back down to 2% has a long way to go,” while further adding that he considers forecasts for two more rate hikes this year a “pretty good guess of what will happen.”
However, as LPL Research’s Chief Economist Jeffrey Roach noted on last week’s blog (FOMC Recap: Connecting the Dots), “Periods of economic regime shifts are difficult for policymakers to manage,” and “median Fed forecasts rarely, if ever, coordinate with actual policy rates.”
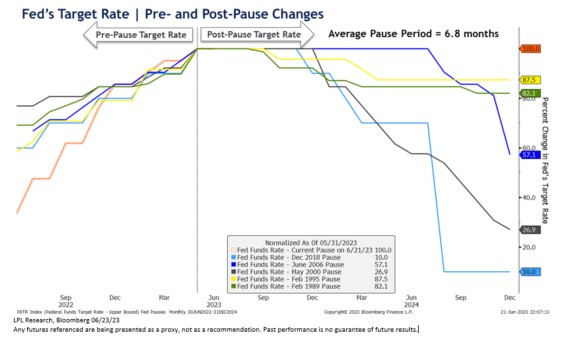
What Historically Happens After a Pause?
Over the last 35 years, there have been five other monetary policy periods when the Fed paused after a major rate-hiking cycle. The chart below provides a before and after perspective of the percent change to the Fed’s target rate during each period and is normalized based on the start of each pause. For example, during the Fed’s pause in December 2018, the Fed’s target rate fell by 90% over the following 15 months (hence the value of “10.0” on the chart). During these periods, it took anywhere from four to 15 months before the Fed started cutting rates, with the average pause lasting 6.8 months.
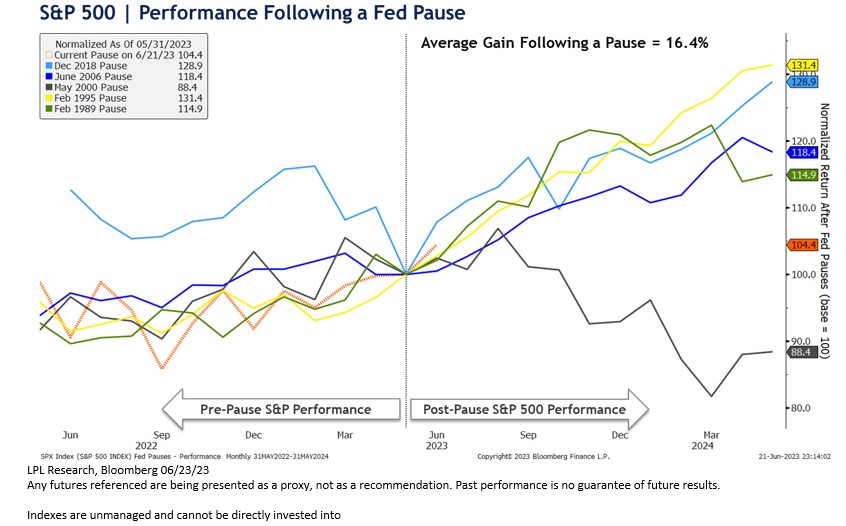
How Have Markets Performed after a Pause?
While the number of occurrences is limited, stocks have done relatively well after a Fed pause following a major rate-hiking cycle. The normalized chart below shows the index traded higher over the following 12 months after four of the last five pauses. The average 12-month return for all five periods was 16.4%. The outlier was the pause in May 2000, two months after the S&P 500’s Dot-com era peak.
Regarding style, value has edged out growth following Fed pauses. The charts below highlight the 12-month pre- and post-Fed pause performance of the Russell 1000 Growth Index (RLG) and Russell 1000 Value Index (RLV).
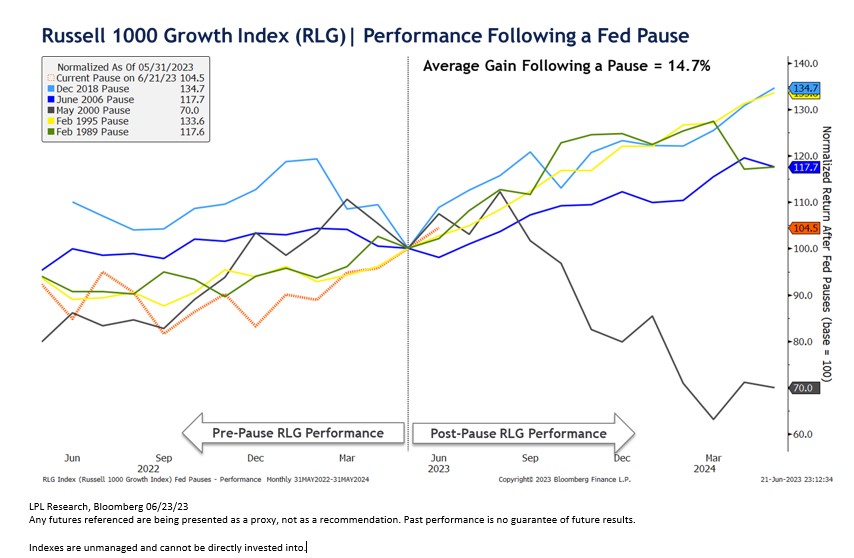
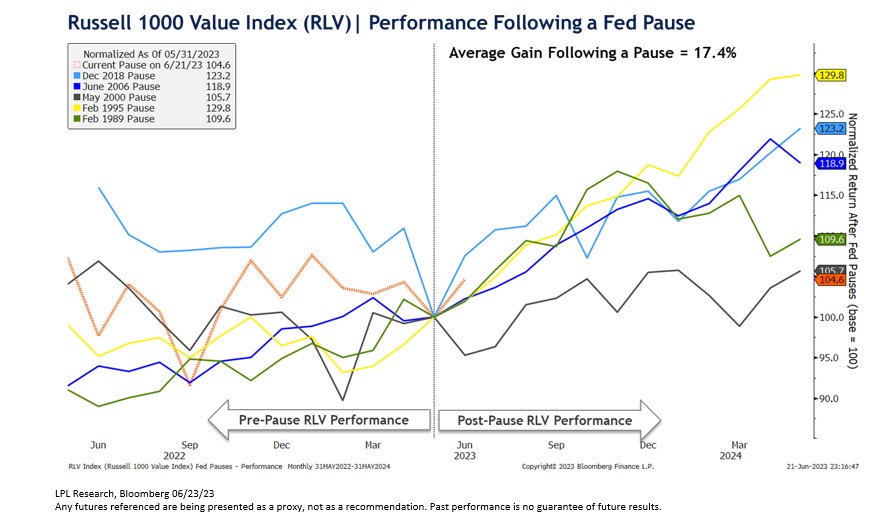
The RLG generated an average 12-month gain of 14.7% after a Fed pause, with four of five periods producing positive returns. The RLV posted an average 12-month gain of 17.4%, with all five periods producing positive returns.
Finally, interest rates have historically receded after a Fed pause. Benchmark 10-year Treasury yields have declined after all five Fed pauses, falling by an average of 13.7% over the following 12 months.
Summary
The Fed has finally paused its rate-hiking cycle. Despite all of the hawkish Fed rhetoric and their forecasts calling for two additional rate hikes this year, equity markets appear to be calling the Fed’s bluff for future tightening. And history may be on their side, as historical pauses following a major rate-hiking cycle have lasted for an average of 6.8 months. After a pause, stocks have done relatively well historically, with value outpacing growth over the following 12 months. Interest rates have also historically declined, including a drop in 10-year yields after all five of the last Fed pauses.
IMPORTANT DISCLOSURES
This material is for general information only and is not intended to provide specific advice or recommendations for any individual. There is no assurance that the views or strategies discussed are suitable for all investors. To determine which investment(s) may be appropriate for you, please consult your financial professional prior to investing.
Investing involves risks including possible loss of principal. No investment strategy or risk management technique can guarantee return or eliminate risk in all market environments. For more information on the risks associated with the strategies and product types discussed please visit https://lplresearch.com/Risks
References to markets, asset classes, and sectors are generally regarding the corresponding market index. Indexes are unmanaged statistical composites and cannot be invested into directly. Index performance is not indicative of the performance of any investment and do not reflect fees, expenses, or sales charges. All performance referenced is historical and is no guarantee of future results.
Unless otherwise stated LPL Financial and the third party persons and firms mentioned are not affiliates of each other and make no representation with respect to each other. Any company names noted herein are for educational purposes only and not an indication of trading intent or a solicitation of their products or services.
All information is believed to be from reliable sources; however, LPL Financial makes no representation as to its completeness or accuracy.
Securities and advisory services offered through LPL Financial, a registered investment advisor and broker-dealer. Member FINRA/SIPC.
Not Insured by FDIC/NCUA or Any Other Government Agency | Not Bank/Credit Union Deposits or Obligations | Not Bank/Credit Union Guaranteed | May Lose Value
Tracking # 1-05373975