
Posted by LPL Research- George Smith, CFA, CAIA, CIPM, Portfolio Strategist

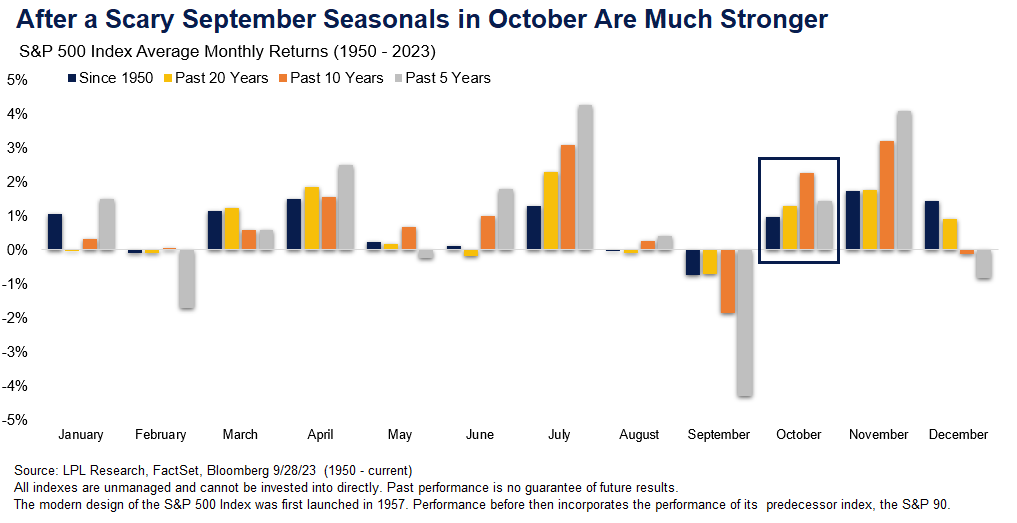
As another scary September for stock markets draws to a close with what will almost certainly be a second consecutive monthly loss for the S&P 500 Index, we take another look at what clues seasonality data may give us for stock market performance during October and the remainder of 2023. So far September has lived up to its reputation, especially in recent years, as being one of the worst months for stocks. In fact, the S&P 500 is on track for its worst monthly return since December 2022. The light at the end of the tunnel is that October has proved far from spooky for investors historically, demonstrating strong monthly seasonals for stocks.
October has been a solid month for stocks with the sixth best monthly returns over the past five years,and third and fourth best over the past 10 and 20 years respectively. Over all periods since 1950 itranks seventh. 10 of the last 11 Octobers have finished with positive returns, with a slight 0.8% decline in 2021 the only trick among a bunch of Halloween treats for stock investors.
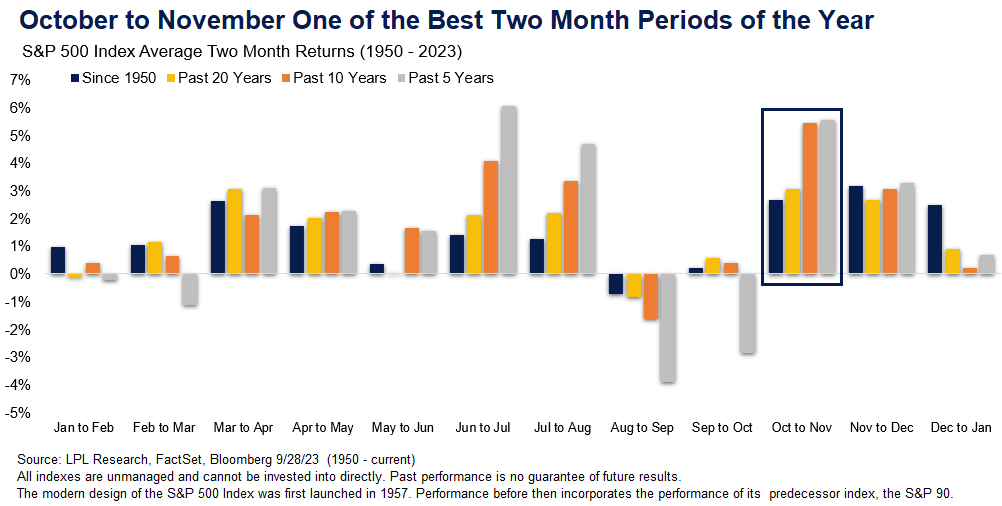
Looking out further the October-November two-month period is on average the strongest of all the monthly pairings over the past five and 10 years and is second strongest over 20 years and all periods back to 1950.
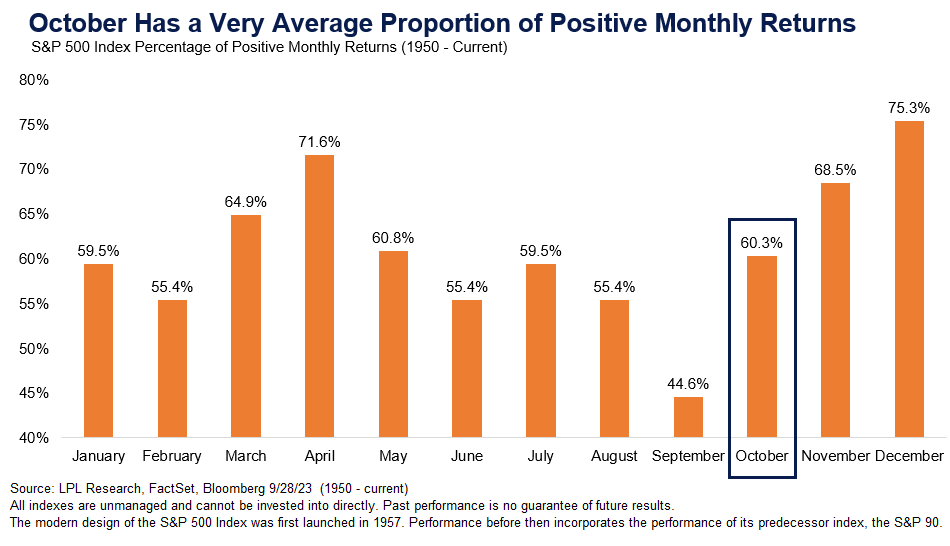
Looking at the proportion of positive monthly returns, at 60.3% October comes in almost right at the long-term average of 60.9% of all months. This statistic also demonstrates strong seasonals to close out the year with November and December showing the highest and third highest proportions of positive monthly returns, while the average month in the fourth quarter is higher 68% of the time compared to months in the remainder of the year at 58%.
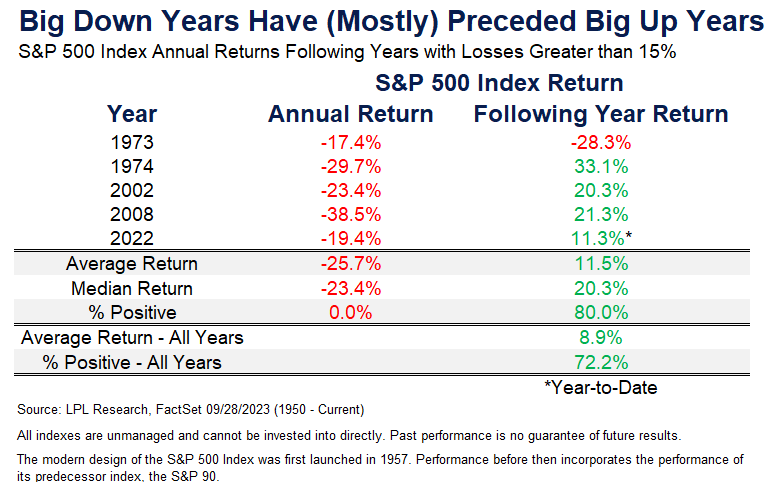
Another slice of data that we have studied is how stocks do the year after a large annual loss of greater than 15%, as we experienced last year with the 19.4% annual drawdown. The good news is that in three of the four occasions since 1950 that there have been calendar year losses this large, the next year’s returns have been well above average. The one huge caveat to this is that 1973 was followed byan even worse year in 1974 before the market bounced back in 1975. Though we acknowledge the small sample size, overall this data demonstrates that the strong returns we have seen year to date, even after the recent pullback, are normal following last year’s losses.
As we have also previously mentioned, the current stage of the presidential cycle is also still supportive for stocks with returns a year out from midterm elections finishing positive every time since 1950, with an average gain of 16.8%.
In summary, after a weak September, seasonals are pointing to a more supportive environment for stocks coming into the year-end. We maintain our slight preference for fixed income over equities in our recommended tactical asset allocation (TAA) as even after the recent equity sell off stock valuations are elevated relative to very attractive bond yields. We continue to see this as a reason to temper enthusiasm for equities, but not to be bearish, remaining neutral equities. We continue to source the slight fixed income overweight from cash, relative to appropriate benchmarks.
IMPORTANT DISCLOSURES
This material is for general information only and is not intended to provide specific advice or recommendations for any individual. There is no assurance that the views or strategies discussed are suitable for all investors. To determine which investment(s) may be appropriate for you, please consult your financial professional prior to investing.
Investing involves risks including possible loss of principal. No investment strategy or risk management technique can guarantee return or eliminate risk in all market environments. For more information onthe risks associated with the strategies and product types discussed please visit
https://lplresearch.com/Risks
References to markets, asset classes, and sectors are generally regarding the corresponding market index. Indexes are unmanaged statistical composites and cannot be invested into directly. Index performance is not indicative of the performance of any investment and do not reflect fees, expenses, or sales charges. All performance referenced is historical and is no guarantee of future results.
Unless otherwise stated LPL Financial and the third party persons and firms mentioned are not affiliates of each other and make no representation with respect to each other. Any company names noted herein are for educational purposes only and not an indication of trading intent or a solicitation of their products or services.
All information is believed to be from reliable sources; however, LPL Financial makes no representation as to its completeness or accuracy.
Securities and advisory services offered through LPL Financial, a registered investmentadvisor and broker-dealer. Member FINRA/SIPC.
Not Insured by FDIC/NCUA or Any Other Government Agency | Not Bank/Credit UnionDeposits or Obligations | Not Bank/Credit Union Guaranteed | May Lose Value
Tracking # 485229